Spatial and temporal changes in origin markets demand
The paper utilizes the Baidu search engine to garner search records of the Duku Road in China over the past decade (Fig. 5a). Results indicate a rapid surge in the attraction of the Duku Road since 2015, peaking in 2019. Despite the impact of COVID-19 in 2020, the demand for tourism quickly rebounded, hitting a new high in 2022. It is imperative to note that due to safety risks associated with the Duku Road, it is only accessible to tourists from May to October every year. During this period, the tourism demand for Duku Road exhibits a primary and secondary peak, with a critical point at the main peak, dividing this phase into a rising and a declining period. Specifically, the rising period commences in early May, peaking towards the end of July, followed by a continual decline. However, a second surge forms during the National Day Golden Tourism Week, which subsequently dwindles gradually.
Figure 5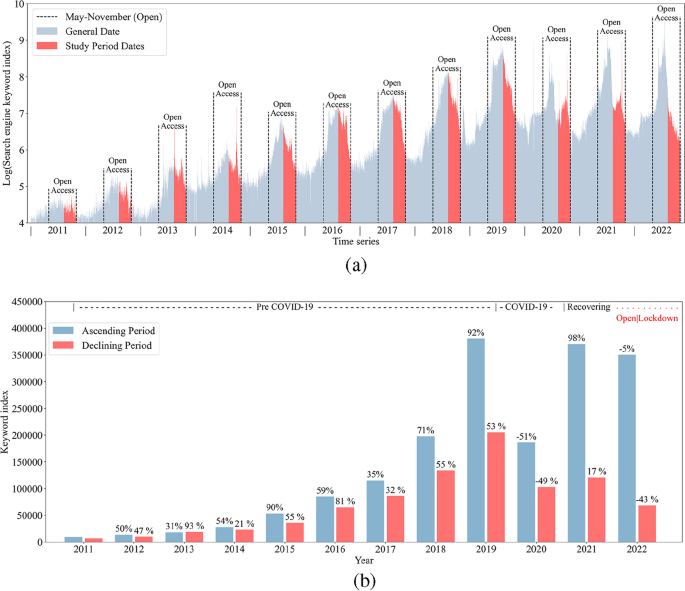
Variation of Baidu index for Duku Road (2011–2022). (a) The daily Baidu Index trend for Duku Road (2011–2022). (b) The Baidu Index during the years of unrestricted access for The Duku Road (2011–2022).
Considering a sudden outbreak of COVID-19 across Xinjiang, local authorities initiated a silent management policy, imposing traffic restrictions from August 10 to October 31. According to historical time series characteristics of the Duku Road, this time point coincides closely with the critical date when the tourism demand transitions from a peak to a decline. A comparison of the keyword index during the rising and declining periods of each year reveals that the tourism demand maintained a high level before the travel restrictions, while the destination closure significantly impacted the tourism demand, causing a sharp decline (Fig. 5b).
Although post August 10, 2022, marked the declining phase of tourism demand for the Duku Road, the Baidu index for the keyword “Duku Road” remained high (only a 5% decrease compared to the same period in 2021) before August 10, 2022. This suggests a stable tourism demand for the Duku Road prior to the pandemic closure. However, post August 10, the Baidu index plummeted by 43% compared to the same period in 2021, inferring a direct impact on the tourism demand for the Duku Road due to the outbreak of COVID-19 in Xinjiang and the traffic control measures. Noteworthy is that despite the inability to conduct any tourism activities in Xinjiang post August 10, the source market maintained a robust potential tourism demand for the Duku Road from August 10 to October 31. During the COVID-19 outbreak and lockdown in Xinjiang, the tourism demand from seven administrative regions in China for the Duku Road grew by an average of 31.49% compared to 2021, indicating a strong resilience in the tourism demand for the Duku Road. This reflects that despite the restrictions imposed by the pandemic and traffic control policies, the restrained tourism demand will gradually be released once the situation is under control, highlighting a significant potential for recovery.
Based on the spatial autocorrelation analysis results (Table 2), the tourism demand from the source market demonstrates a significant spatial clustering pattern, with the spatial pattern of the Duku Road’s source market transitioning from a low level to a moderate level of spatial clustering. The spatial distribution of tourism demand from source cities to the Duku Road has been impacted by the pandemic crisis, exhibiting a trend of contraction and clustering towards core source cities.
Table 2 The spatial pattern of origin markets.
Viewed from the perspective of source cities, this section utilizes the Jenks Natural Breaks method to categorize source cities into five groups based on the intensity of tourism demand towards Duku Road and constructs a spatial distribution map of tourism demand from the source market. The map employs a color gradient from blue to red to represent the intensity of tourism demand from source cities to the Duku Road, where red and orange cities signify core and secondary source cities, respectively. The domestic source market is primarily distributed in the developed cities in eastern China. In Fig. 6a,b, cities like Beijing and Shanghai are identified as core source cities, while Chengdu, Chongqing, Hangzhou, and Guangzhou are recognized as secondary source cities. A comparison between Fig. 6a,b reveals that cities like Lanzhou, Xi’an, and Nanjing no longer serve as secondary source locations, indicating that some secondary source cities are more sensitive to the tourism demand for Duku Road under Xinjiang pandemic crisis than others, which exhibiting a variability within the secondary source market.
Figure 6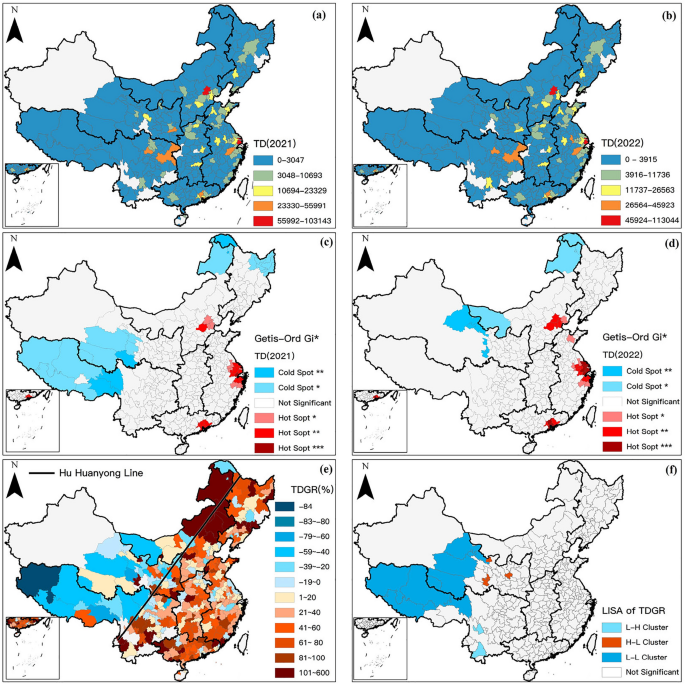
The spatial patterns of tourism demand and its’ variation. Notes: Hu Huanyong Line in (e) is a comparison divider proposed by Chinese geographer Hu Huanyong (1901–1998) in 1935 to delineate the population density of China, which has significant heterogeneity in the population, society, and economy between the east and west of the line.
Upon further hotspot analysis of the source market, the results exhibit significant statistical clustering in the spatial domain for the Duku Road’s source market. As depicted in Fig. 6c,d, the red zones represent the hotspots of tourism demand, encompassing the Jing-Jin-Ji region, Yangtze River Delta, and the Pearl River Delta, which emerge as the most crucial source markets with lesser impact from the pandemic crisis on Duku Road. On the other side, the blue zones signify the cold spots of tourism demand, where cities within these regions exhibit an exceedingly low tourism demand towards the Duku Road. A comparative inspection of Fig. 6c,d unveils a shift in some cold spot areas (for instance, the disappearance of the cold spot on the Qinghai-Tibet Plateau, and the emergence of a new cold spot area north of the Hexi Corridor), while the stability of cold spot regions in Northeast China remains high (such as Hulunbuir and Daxing’anling area).
This section analyzes the growth rate of tourism demand, designating cities with growth rates below zero with a gradient of cool colors (blue), and those with growth rates above zero with a gradient of warm colors (red), with intervals of (±) 20%. As shown in Fig. 6e, cities with a growth rate exceeding 100% are rendered in deep red. There is a significant positive correlation in the spatial distribution of tourism demand growth rates, indicating neighboring cities share a consistent response pattern to the pandemic. A distinct contrast is formed on either side of the Hu Huanyong Line; source markets to the east primarily exhibit positive growth rates, while those in the western regions display negative growth rates. Analysis of local clustering and outliers reveals the formation of three distinct local clusters in the spatial distribution of tourism demand growth rates (Fig. 6f). Cities near the Qinghai-Tibet Plateau and Hexi Corridor in Northwestern China respond strongly to the pandemic crisis, with rapid declines in tourism demand towards Duku Road in this area (L–L). A sporadic distribution of outlier cities (H–L) emerges on the eastern side of Northwestern China, exhibiting superior risk resilience and higher tourism demand compared to other local areas. In Southwest China, Yunnan province has higher demand growth, with Pu’er and Lijiang being typical tourist cities. The fluctuations in their demand are impacted by their respective tourism industries, exhibiting a phenomenon where they are encircled by proximate cities experiencing high demand growth rates (L–H).
By dividing the source market according to administrative regions, summing up the tourism demand from cities within each administrative region to Duku Road, and averaging the growth rate of tourism demand, regional differences are identified. As shown in Fig. 7, a comparison of tourism demand scale and growth between 2021 and 2022 across administrative regions is made. Using the Jenks Natural Breaks method, they are categorized into high, medium, and low levels. This corresponds to East China being the primary source market for Duku Road, while North, Central, South, Southwest China are secondary source markets, and Northeast and Northwest China are potential source markets. Northeast and South China have the highest growth rates in tourism demand, followed by North, Central, and East China, with Southwest and Northwest China having the lowest. There is minimal variation in the scale of tourism demand from cities within each region to Duku Road, but a larger difference in the growth rates of tourism demand.
Figure 7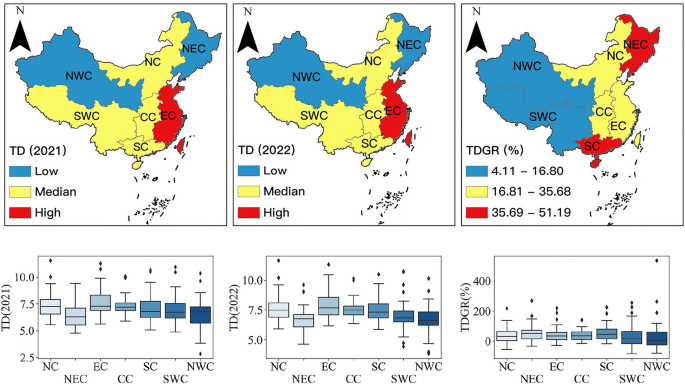
The maps with box plots of the tourism demand and growth rates.
Correlation analysis for TDGR
The correlation between explanatory variables and the growth rate of tourism demand significantly varies across different regions, suggesting that a more nuanced analysis could be obtained by partitioning the source market for modeling. In the South China region, 64% of the explanatory variables are negatively correlated with the growth rate of tourism demand, while in the Northwest region, no explanatory variables exhibit significant correlation. In the Northeast region, only two explanatory variables are negatively correlated with the tourism demand growth rate. In East China, Southwest, North China, and Central China, about one-third of the explanatory variables show a correlation with tourism demand growth rate at a significance level better than 0.05.
The correlation results indicate that under the “dynamic zeroing” policy control, new cases in source areas do not correlate with the potential tourism demand growth rate of residents. For instance, the numbers of newly confirmed and asymptomatic cases only show a negative correlation with the tourism demand growth rate in the South and Southwest regions of China. The relationship between the number of COVID-19 recovered patients and the tourism demand growth rate differs between the southern and northern regions, showing a weak positive correlation in the Southwest region and a weak negative correlation in the North China region. Notably, a significant moderate negative correlation exists between public medical resources of local source cities and the tourism demand growth rate. In the post-pandemic era, factors related to tourism demand growth rate are constantly changing, and the relationship between influential factors and tourism demand growth rate shows spatial non-stationarity across different regions.
Significant explanatory variables in the East China region include per capita disposable income, average wages, consumer price index, savings deposits, the number of people covered by basic medical insurance, and highway passenger traffic. In South China, the variables include the resident population, per capita GDP, per capita disposable income, per capita consumer spending, savings deposits, PM2.5 concentration, AQI index, newly confirmed cases, newly confirmed asymptomatic cases, the number of hospitals, hospital bed count, basic medical insurance coverage, mobile phone user count, broadband access user count, private car ownership, and civil aviation passenger traffic. In Southwest, the variables include per capita GDP, infection count, newly confirmed cases, newly confirmed asymptomatic cases, recoveries, private car ownership, highway passenger traffic, and spatial distance. In North China, significant variables include savings deposits, industrial solid waste utilization rate, recoveries, mobile phone user count, broadband access user count, and private car ownership. In Central China, the variables include per capita GDP, savings deposits, AQI index, hospital bed count, basic medical insurance coverage, mobile phone user count, broadband access user count, private car ownership, and spatial distance. In Northeast, the significant variables are average wages and savings deposits. In Northwest, no significant explanatory variables have statistically meaningful correlation with tourism demand growth rate.
Stepwise regressions
Diverging from studies that directly engage in regression analysis with correlation tests6, this chapter adopts a stepwise regression modeling approach. It sequentially incorporates significant explanatory variables from Table 3 (highlighted in bold) for each region into the model to explore influential factors under optimal fitting circumstances. However, the results of stepwise regression analysis reveal that in the Northeast and Northwest regions (Table 4), due to a limited number of significant explanatory variables and a lack of significant linear relationships between these variables and the dependent variable, no effective models are obtained. In other regions, there is a noticeable disparity between influential factors and model fit.
Table 3 The correlation of scaled proxy variables with TDGR in regions.Table 4 The results of stepwise regressions in regions.
In East China, average wages are the sole factor affecting the growth rate of tourism demand, albeit with weak explanatory power (R2 = 0.08). In South China, the AQI index exerts a negative impact on the tourism demand growth rate, contributing to 17.9% of the variance explanation. In North China, the growth rate of tourism demand is negatively affected by the industrial solid waste utilization rate, with an explanatory power of 17.8%. In Central China, per capita GDP is a significant factor negatively impacting the tourism demand growth rate. In the Southwest region, the tourism demand growth rate is influenced by multiple factors, where spatial distance has a positive impact, and per capita GDP has a significant negative impact. Combined, they account for 42% of the explanatory power concerning the growth rate of tourism demand.
In summation, the growth rate of tourism demand in source markets chiefly hinges on local economic, environmental, and transportation factors. Although there is a significant weak correlation between the local pandemic situation and the tourism demand growth rate in certain areas, it fails to exert a statistically significant impact on the local tourism demand towards the Duku Road.
The efficacy of the models has been corroborated by the diagnostic items and parameters delineated in Table 5. The results indicate that the models passed the F-test (p < 0.05), implying that the independent variables in each model significantly affect the dependent variable TDGR, denoting the models are meaningful. With a limited number of dependent variables in the models, the VIF (Variance Inflation Factor) values are well below 5, suggesting that there is no multicollinearity issue, and the models are well-constructed.
Table 5 The results of the model diagnostics.
In the autocorrelation test of the models, the D-W (Durbin-Watson) value of the model for the South China region deviates significantly from 2 (1.508 < 1.7), indicating that the significance testing and goodness of fit for this model would be unreliable; hence, this model failed the validation, while the other models are deemed credible. Moreover, this section re-models using TDR from Sect. 7.2.2 as an alternative dependent variable following the framework procedure. The results of the new model are consistent with the conclusions previously obtained, eventually leading to linear regression models for the tourism demand growth rate in four regions.
Factors affecting TDGR
The response to the changes in tourism demand for the Duku Road during the pandemic period is manifested through the tourism demand growth rate of the source cities. The results of the regional model construction discussed earlier (see section “Stepwise regressions”) indicate that the factors affecting the growth of tourism demand for the Duku Road vary significantly across different regions. As shown in Fig. 8, on a national scale, the models for the North China, Central China, East China, and Southwest regions have all passed the significance test and robustness test. Each model corresponds to a subplot, with the title of the subplot being the model formula for the respective region, and the content of the subplot displaying the spatial distribution of the tourism demand growth rate and explanatory variables. All indicators are divided into five intervals using the Jenks Natural Breaks classification method, with colors from blue to red representing intervals from low to high.
Figure 8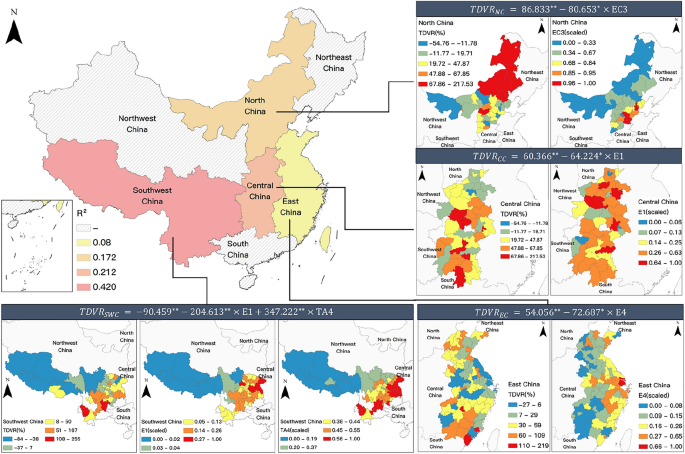
The influential factors models of response heterogeneity of tourist origin markets to Duku Road.
Upon comparing the similarities and differences across regional models, it is found that during the pandemic period in Xinjiang, the primary factors influencing the response differences to destination lockdowns in the domestic source markets for the Duku Road include Per Capita GDP, average wages, industrial solid waste utilization rate, and spatial distance. Economic factors have a counteractive effect on the tourism demand growth of the source cities, an impact widely present in East China, Central China, and Southwest regions, exhibiting robust spatial consistency. Notably, environmental factors indicate that the growth of tourism demand is constrained by the industrial solid waste utilization rate, a significant relationship found only in North China. This section observes that in industrially prosperous areas within this region (Hebei-Tianjin), the growth of tourism demand is limited, or even decreased, whereas in remote areas with lower industrial levels (Inner Mongolia), the tourism demand is not high, but generally has a high rate of growth. The significant positive impact produced by the distance factor in the Southwest region can be attributed to the distinct differences between the Qinghai-Tibet Plateau and the Sichuan-Chongqing-Yunnan-Guizhou Plateau; the former has low levels of tourism demand and growth rate, while the latter has relatively higher tourism demand and growth rate, thereby leading to a higher tourism demand growth response in source cities farther from the Duku Road.
Factors influencing tourism demand towards Duku road
Understanding the factors influencing the tourism demand from source cities to Duku Road is crucial for grasping the heterogeneity in tourism demand growth rates. This section employs a loop iteration approach to individually examine the linear fit between twenty-five explanatory variables of source cities within seven administrative regions, and the tourism demand scale of these cities towards Duku Road, to investigate the factors affecting the tourism demand scale of source cities to Duku Road. From a total of 175 linear models, eight models were identified as statistically significant and demonstrating a superior degree of fit ultimately. These models, with a significance level exceeding 0.01 and an R2 value greater than 0.8, effectively explain the scale of tourism demand across more than four administrative regions.
As illustrated in Table 6, different variables significantly positively impact the demand for tourism to the Duku Road across various regions. The rise in the number of broadband and mobile phone users suggests more individuals have mobile communication capabilities, enhancing the accessibility to information regarding Duku Road. This improved digital outreach fosters the online visibility and awareness of the destination, consequently boosting the local residents’ desire to travel there. Savings deposits reflect the economic capacity of individuals or families in the source cities, laying the foundation for affording travel to Duku Road. A higher per capita Gross Domestic Product indicates a relatively higher income level and consumer spending capacity, enabling more discretionary income for long-distance travel expenditures. The economic stature of the source cities implies a higher preference for tourism and a more open cultural backdrop, collectively fostering an increased interest and demand for traveling to Duku Road. An augmentation in the number of individuals covered by basic medical insurance and the quantity of hospital beds signifies enhanced medical security for more residents. Better medical services and emergency response capabilities help mitigate the impact of local epidemics on residents’ travel activities. Simultaneously, it alleviates tourists’ concerns about the travel risks and uncertainties associated with the epidemic situation in Xinjiang, bolstering their confidence in traveling to Duku Road. Higher air passenger traffic denotes more flight connections between the residents and the destination, supporting the accessibility for inland tourists to Duku Road. Elevated private car ownership in source cities inclines residents towards choosing self-driving tours to Duku Road, offering greater flexibility, freedom, comfort, and convenience. This mode of travel satisfies tourists’ desire to explore the scenic routes of Duku Road and indulge in personalized experiences.
Table 6 The results of the models in regions.
In summary, determinants such as the extent of internet coverage, economic conditions, medical security, and transportation facilities in the source markets influence the residents’ demand for tourism to the Duku Road in various aspects. The extent of internet coverage lays the foundation for environmental awareness of the Duku Road among residents of the source cities; whereas economic conditions are essential for residents to travel to the Duku Road. Amid an ongoing pandemic, medical security in the source cities can mitigate the adverse effects of the local epidemic on residents’ travel behaviors; transportation conditions provide diversified accessibility for the residents of the source cities. In the source markets of the Duku Road, areas with a large scale of mobile phone users, high residents’ savings, comprehensive medical insurance coverage, and developed passenger aviation contribute the most to the tourism demand to the Duku Road. This conclusion aligns with the spatial pattern of tourism demand discussed in section “Spatial and temporal changes in origin markets demand”. As illustrated in Fig. 9, box plots of the number of mobile phone users (IA1), savings deposits (E6), the number of individuals covered by basic medical insurance (H3), and the volume of civil aviation passengers (TA3) demonstrate that the Eastern China region ranks highest in these four indicators nationwide, and concurrently, it has the highest demand for tourism to the Duku Road. Furthermore, summarizing the determinants in Table 6 and arranging them in descending order based on the average R2 reveals that the economic conditions > transportation accessibility > medical conditions > extent of internet coverage, indicating that economic conditions are the most crucial determinant affecting the scale and spatial pattern of tourism demand in the source markets.
Figure 9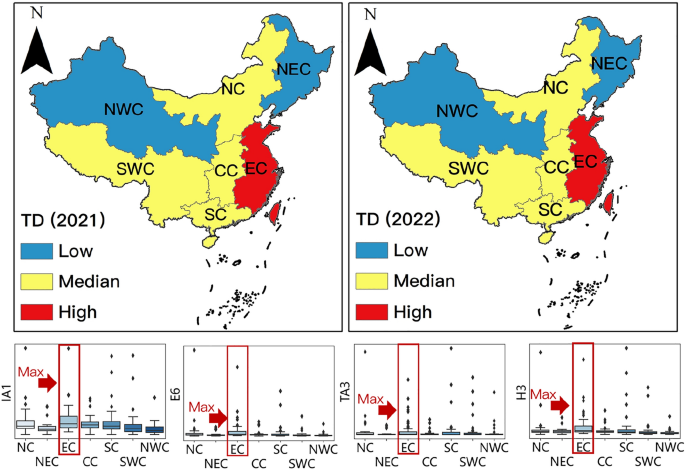
Tourism origins market maps corresponding with boxplots of variables in regions.

