The drivers of centrality variation in tourists and visitors networks
In this section, we show the results related to our RQ1, through the analysis of the main factors influencing the variation of centrality of municipalities in the tourists network with respect to the visitors network. In particular, we focus on drivers of variation of instrength, betweenness and efficiency over the 12 months of 2022. This analysis may thus support policy makers in a better comprehension of the main factors stimulating alternative types of tourism behaviour.
In Fig. 3, the upper panel shows the coefficients of a set of variables related to tourism services and attractions aiming to explain the variation of instrength in the tourists with respect to the visitors network. Interestingly, one additional accommodation bed induces higher tourists inflows rather than visitors trips between 0.11% and 0.31%. The positive relationship is stable along the year, with a higher magnitude in the first three months of the years.
Furthermore, the presence of cultural heritage items and ski routes tends to increase the centrality of nodes in the tourists with respect to the visitors network in terms of instrength by a portion between 0.15% and 0.33% and between 0.16% and 1.05%, respectively. During Spring and Summer months, with the exception of August, also natural reserves contribute to raising tourists with respect to visitors inflows (\(\beta\) between − 0.01 and 0.71). On the other hand, festivals (\(\beta\) between − 0.27 and − 0.09) and the presence of intermodal nodes (\(\beta\) between − 0.55 and − 0.34) reduce the instrength centrality in the tourist network, as well as the book shops (\(\beta\) between − 1.13 and 0.12) with the exception of January, March, August and December.
Such results suggest that the availability of tourism accommodation infrastructures, natural and cultural endowments and services related to ski activities foster overnight stays rather than short visits. On the other hand, temporary entertainment activities (e.g. festivals) or transportation infrastructures, such as intermodal nodes, boost short term visits with respect to tourists inflows.
The middle panel in Fig. 3 analyses the drivers of the percentage variation of betweenness in the tourists with respect to the visitors network. Interestingly, we observe a different pattern with respect to that observed for the instrength. Indeed, in this case accommodation infrastructures, cultural and natural attractions do not foster this centrality indicator in the tourists network. On the other hand, we highlight that for the betweenness, critical factors are represented by transportation services and infrastructures. Indeed, we identify a negative and statistically significant coefficient along the whole year for methane distributors (\(\beta\) between − 0.75 and − 0.16) and intermodal nodes (\(\beta\) between − 0.56 and − 0.19), thus meaning that higher values of these variables stimulate higher betweenness in the visitors network with respect to the tourists network by percentages between 0.16% and 0.75% and between 0.19% and 0.56%, respectively.
This result suggests that nodes with higher transportation infrastructures endowments tend to be present in many shortest paths connecting municipalities in the visitors network, meaning that they are key factors to attract short term visits, while they do not represent characteristics stimulating strong tourists flows. We find a similar negative coefficient also for festivals (\(\beta\) between -0.27 and -0.05), confirming that such temporary recreational activities may foster short term visits with respect to overnight stays by a percentage between 0.05% and 0.27%.
We observe that the availability of ski routes increases the betweenness in the tourists network during winter months (e.g. January, February), while it raises short term visits in the summer months of August and September, thus highlighting the role of skiing activities in attracting alternative types of tourism behaviours, depending on whether the “snow season” is open or not.
The lower panel of Fig. 3 investigates the factors that contribute to a variation of efficiency in the tourists with respect to the visitors network.
Similarly to the instrength, we find that a larger availability of accommodation beds (\(\beta\) between 0.02 and 0.04), ski routes (\(\beta\) between 0.07 and 0.31) and natural reserves (\(\beta\) between 0.06 and 0.17) increases this centrality indicator for the tourists network.
Figure 3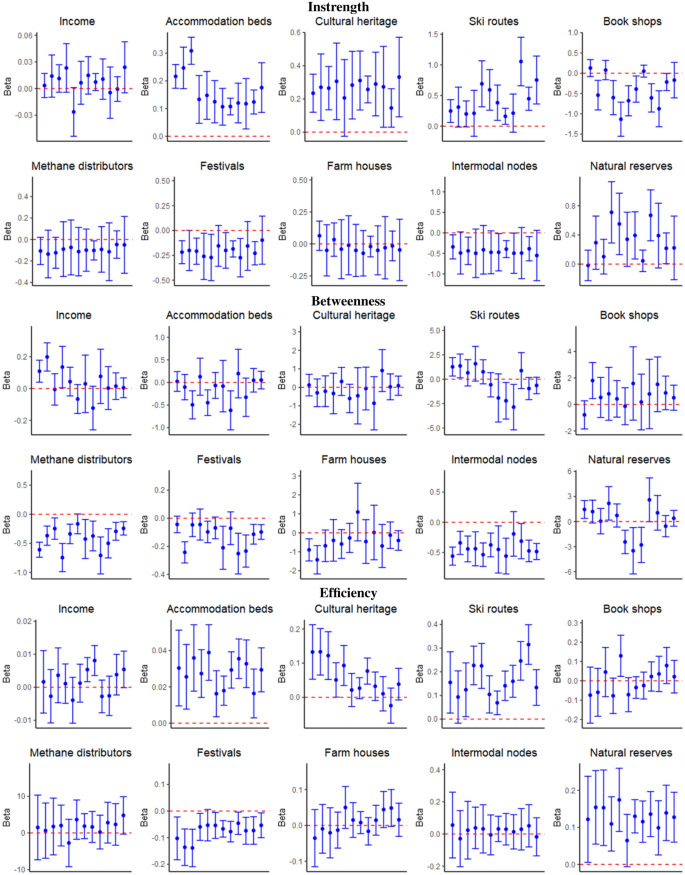
We show the monthly coefficients of drivers of delta performances of a set of centrality indicators computed in the tourists and visitors networks. The plots refer to the estimates obtained through the model introduced in Eq. (1). The upper panel refers to drivers of instrength variation. The middle panel refers to drivers of betweenness variation. The lower panel refers to drivers of efficiency variation. This figure was realized using the R software (4.2.3 version).
Also the presence of cultural heritage items (\(\beta\) between − 0.02 and 0.13) raises the proximity of municipalities to the other nodes in the tourists network, especially in the first half of the year. We rather confirm that festivals (\(\beta\) between − 0.14 and − 0.05) are key drivers of visitors flows. Differently from the instrength case, we do not find a negative impact of intermodal nodes, suggesting that transportation infrastructures do not reduce the centrality of nodes in the tourists with respect to the visitors network. This may be due to the fact that the instrength considers only individuals inflows, whereas the efficiency accounts for both people exiting from and entering into a municipality.
Overall, such results highlight the heterogeneity of drivers of tourists and visitors movements. In particular, this analysis, related to our RQ1, shows that the former tend to be more attracted by the availability of accommodation infrastructures, natural and cultural endowments, while transportation services and temporary entertainment activities mainly foster same-day visits.
Moreover, we find that some attractions such as ski routes and natural reserves may further stimulate tourists flows during Spring/Summer and Winter, respectively, thus suggesting the relevance of seasonal patterns, as questioned by our RQ3. This evidence may thus allow policy makers to identify the main leverages to design more precise strategies to attract specific types of tourism behaviour.
Gravity model evidence
Since Lombardy municipalities display relevant percentage variations in terms of instrength, betweenness and efficiency computed on the network of visitors and tourists, we investigate the extent to which centrality indicators based on same-day visits might be relevant drivers of overnight stays flows. We do this through the gravity model introduced in Eq. (4). This analysis aims to address our RQ2 and to study the extent to which areas attracting high levels of tourists are particularly appealing also for visitors, or if instead municipalities tend to attract people with alternative tourism behaviours.
Figures 4, 5 and 6 show the estimates of the coefficients of the main drivers of tourists flows across Lombardy municipalities over 12 months of 2022 with related confidence intervals (see Section SI5 and Tables S5, S6, S7 and S8 for more details). Furthermore, we assess the corresponding coefficient obtained through a model aggregating yearly flows across municipalities. In this way, in line with our RQ3, we assess whether coefficients of this set of variables are stable over the year or seasonal patterns strongly affect the main factors stimulating tourism.
Consistently with gravity model theory, we observe the stronger flows of tourists are observed between municipalities with a larger number of inhabitants in line with previous results obtained by24 and25 for the Italian context. According to the yearly model, a 1% growth of origin municipality population leads to an increase of tourists flows equal to 0.32%. The same figure accounts for 0.30% for destination municipalities. Coefficients with a stronger magnitude and statistically significant are observed when we consider monthly models, with values between 0.44 and 0.69 for origin places and in the range 0.18–0.86 for destinations (the only exception is the month of January where the coefficient is still positive but not statistically significant).
Interestingly, we find a not statistically significant estimate for the instrength of destination municipalities over the first half of the year (some exceptions are June, July, September, October and November in the second half of the year). This result suggests that at least over the period January-May, places with large tourists inflows are not necessarily characterized also by a large number of visitors, highlighting the presence of different drivers in play for overnight stays and same-day trips. This result is reinforced by the fact that the coefficient for the yearly model is positive but not statistically significant. On the other hand, more similar determinants between tourists and visitors flows seem to be in place during the Summer and Autumn months.
Such evidence is complemented by the authority score of destinations that tends to exhibit a negative and significant coefficient (\(\beta\) between − 0.81 and − 0.19) with few exceptions (April, December). This is particularly interesting since it can be interpreted as if municipalities with strong tourism inflows are receiving limited visitors flows from hubs in the visitors network. Therefore, the combined evidence of instrength and authority variables directly addresses our RQ2, by suggesting that municipalities with large tourists inflows are not necessarily characterized by a large number of same-day visits. Furthermore, such visitors do not come from municipalities that experience large visitors outflows. This evidence also holds at aggregate annual level with a significant \(\beta\) = − 0.68. Such result corroborates that alternative drivers may motivate tourists and visitors flows, meaning that, for policy makers, it may be complex to attract at the same time alternative types of tourism behaviours.
We observe that the instrength of origin municipalities has a not statistically significant coefficient over the whole year. This means that the number of tourists outflows is not strongly related to the number of visitors inflows. Such relationship is quite stable across months of 2022 and confirmed in the aggregate yearly model. This points to the fact that over the whole year, large tourists outflows are not necessarily compensated by high visitors inflows. Conversely, we obtain a negative coefficient for the authority of origin places at annual level (\(\beta\) = -0.82). Such relationship, that is confirmed at monthly level with a lower statistical significance, suggests that in municipalities with large tourists outflows, visitors inflows do not come from municipality hubs in the visitors network.
We find a different result for the outstrength indicator. For the origin municipalities the coefficient is negative and statistically significant over a significant portion of the year (e.g. in the months of April, May, July, October, November and December with values between − 0.63 and − 0.41). This pattern shows that places with large outflows of tourists are characterized by a not significant or even negative relationship with the volume of visitors exiting from the same municipality, suggesting that territories tend to experience outflows of individuals with alternative tourism behaviours. The coefficient of the yearly model is negative and statistically significant (\(\beta\) = − 0.48), meaning that the different patterns of tourists and visitors outflows in the same municipality are stable along the year.
Also in this case such result can be complemented by the coefficient obtained for the hub score of origin municipalities to address our RQ2. The positive and significant (\(\beta\) between 1.34 and 2.28) coefficients suggest that territories with large tourists outflows are hubs of the visitors network, meaning that they are municipalities sending visitors towards areas attracting large visitors flows. The combined evidence of outstrength and hub score highlights that places with strong outflows of tourists experience limited visitors outflows. However, those visitors exiting the municipality tend to converge toward areas attracting large short visits inflows.
Similar evidence holds for places of destination for both outstrength and hub score, thus suggesting that areas attracting larger tourist inflows experience a low number of visitors outflows that tend to be catalyzed by municipalities with large numbers of same-day visits.
Combining the interpretation of alternative network indicators, we can thus obtain complementary knowledge on the behaviour of tourists and visitors, supporting the identification of more effective tourism management strategies. For instance, being aware of more likely origins and destinations of tourists and visitors flows may allow policy makers to invest on better connections, transportation facilities, customized services and attractions, improving the economic impact of tourism related activities.
We spot a positive interplay over the majority of months of the year for the betweenness of places of destination (\(\beta\) between 0.04 and 0.13 and not significant in the months of February, July and October). Such relationship is confirmed at annual aggregate level (\(\beta\) = 0.07 and significant with a confidence level of 10%). This provides evidence that places with large tourists inflows represent nodes belonging to a large number of shortest paths across municipalities in the visitors network. This is particularly relevant since it suggests that nodes bridging alternative communities of areas in the visitors network may be selected also as strategic places to spend the night by tourists.
We rather find a not statistically significant relationship for the betweenness of places of origin. A consistent result is obtained for the efficiency indicator. Also in this case, we find a positive coefficient for places of destination, with such relationship becoming significant especially during the second half of the year (\(\beta\) between 0.06 and 0.12). This result corroborates the previous evidence obtained with the betweenness, confirming that large tourists inflows are experienced by municipalities with a key role in spreading visitors mobility. We do not find a statistically significant relationship for places of origin both at monthly and yearly level.
Overall, these relationships between tourists flows and the majority of centrality indicators computed in the network of visitors suggest that alternative drivers may have a critical role in stimulating overnight stays and same-day trips, since areas with large tourists flows are not necessarily central in the visitors network. In terms of our RQ2, we highlight the presence of a trade-off in the capability of municipalities to attract at the same time large visitors and tourists flows (In terms of external validity, we should acknowledge that the Lombardy region has some specific peculiarities within the Italian context, since it is the largest in terms of population (accounting for almost 17% of total Italian inhabitants) and the richest in terms of income per capita. Moreover, Milan attracts large mobility flows also due to commuting patterns. Therefore, strong attentions should be provided when trying to generalize such results to other Italian contexts. However, it should be noted that41 demonstrated the adequate capability of this mobile network dataset to properly capture tourism related mobility also in the city of Rome, that similarly to Milan, is characterized by a large presence of commuters. Therefore, although findings should be carefully checked depending on the specific territory that is object of analysis, our empirical framework and the dataset may be reasonably applied across different Italian areas to study the main drivers of tourists and visitors flows).
In coherence with the gravity model, we also observe a negative and statistically significant coefficient for the travel distance across municipalities (\(\beta\) between − 1.01 and − 0.76), suggesting that stronger tourists flows are observed across municipalities that are closer to each other. Our results confirm previous evidence obtained by24 estimating a spatial Durbin model to assess the drivers of international tourism towards Italian provinces. On the other hand, we do not find evidence that a higher density of tourism attractions between municipalities, tends to reduce the flows across such nodes. Few exceptions at a significance level of 10% are the presence of festivals in January, August, November and December, the presence of ski routes in July and intermodal nodes in September October and November.
We rather spot interesting patterns for categorical variables related to the cluster assigned to Lombardy municipalities in Section SI4, and allowing us to better investigate our RQ3.
Our reference cluster is represented by the Not specific tourism group. We observe that destinations in the Mountain cluster experience larger tourists flows along the year (\(\beta\) between 0.45 and 1.38), with coefficient that are higher during Winter months (e.g. December-March) when people have the opportunity to ski or in the Summer (e.g. June, July, August), in a period characterized by milder climate conditions.
Figure 4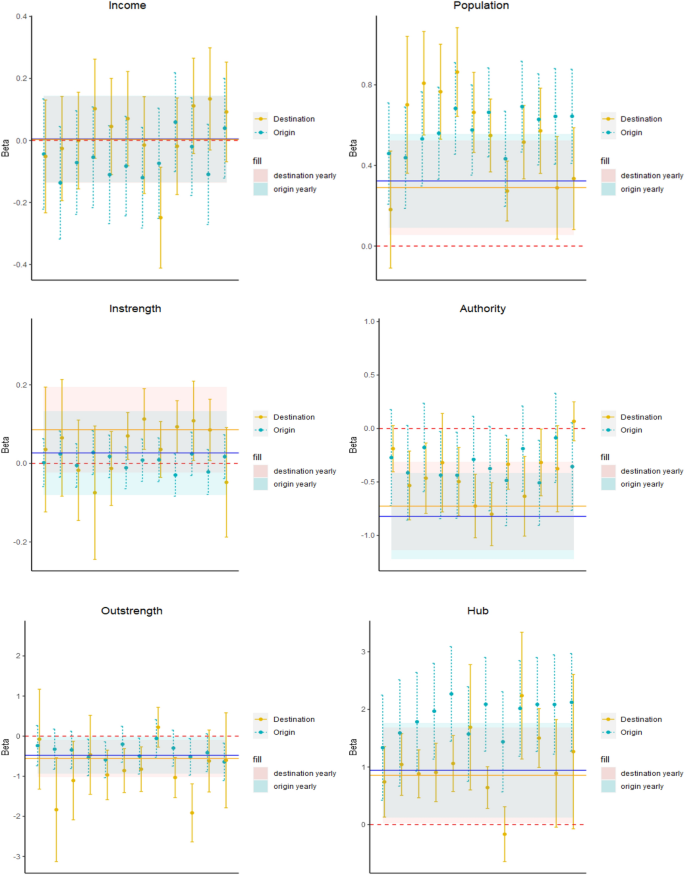
The monthly coefficients of drivers of monthly flows across municipalities in Lombardy. The plots refer to the estimates obtained through the gravity model introduced in Eq. (4). Vertical segments refer to the point estimates with 95% confidence intervals estimated over the 12 months. The horizontal line refers to the point estimates and 95% confidence intervals of the same gravity model using aggregate yearly (rather than monthly) tourists flows across Lombardy municipalities. Part I. This figure was realized using the R software (4.2.3 version).
Figure 5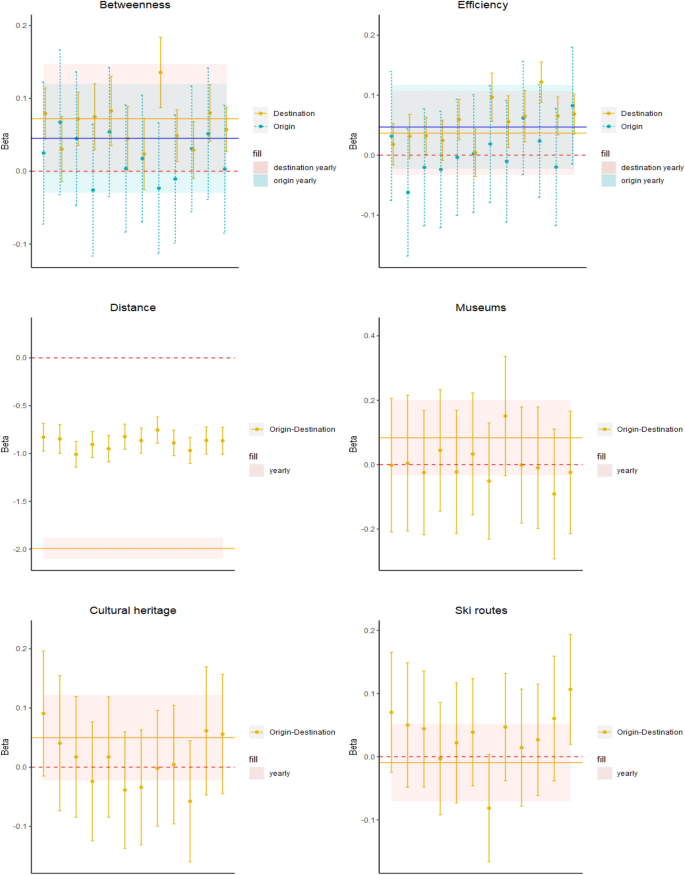
The monthly coefficients of drivers of monthly flows across municipalities in Lombardy. The plots refer to the estimates obtained through the gravity model introduced in Eq. (4). Vertical segments refer to the point estimates with 95% confidence intervals estimated over the 12 months. The horizontal line refers to the point estimates and 95% confidence intervals of the same gravity model using aggregate yearly (rather than monthly) tourists flows across Lombardy municipalities. Part II. This figure was realized using the R software (4.2.3 version).
Figure 6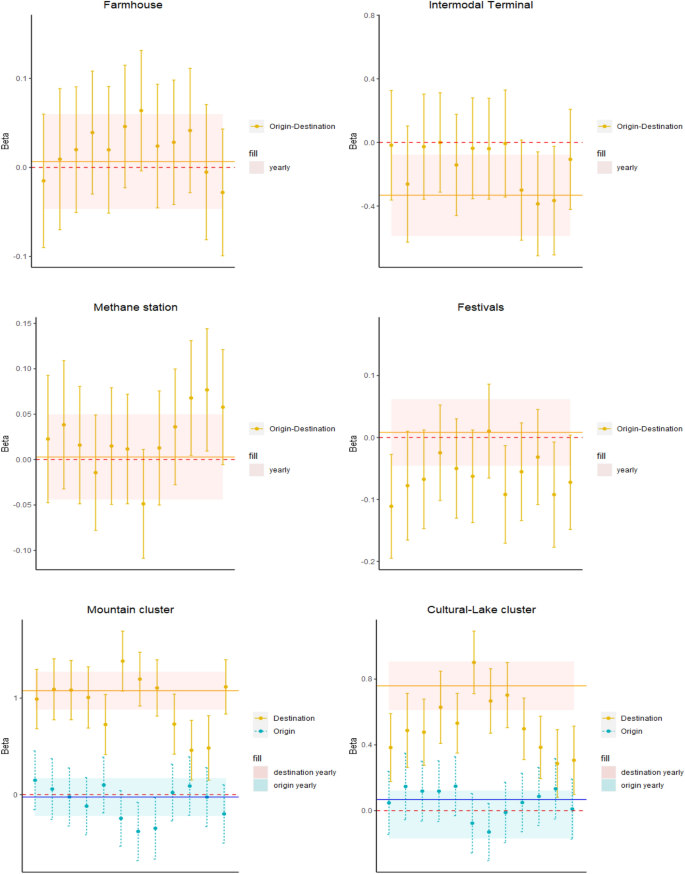
The monthly coefficients of drivers of monthly flows across municipalities in Lombardy. The plots refer to the estimates obtained through the gravity model introduced in Eq. (4). Vertical segments refer to the point estimates with 95% confidence intervals estimated over the 12 months. The horizontal line refers to the point estimates and 95% confidence intervals of the same gravity model using aggregate yearly (rather than monthly) tourists flows across Lombardy municipalities. Part III. This figure was realized using the R software (4.2.3 version).
Interestingly, also Cultural-Lake areas exhibit larger tourists inflows, as suggested by the positive coefficients for destination places. In this case, the coefficient is higher during Summer, whereas it is lower during Winter months, suggesting that tourists prefer spending time in such places in periods characterized by better weather conditions (\(\beta\) between 0.29 and 0.90). In both cases, we rather do not tend to find evidence of significant coefficients for places of origin, suggesting that drivers to exit the municipality of residence for tourism reasons are homogeneous across clusters over the year.
Concerning our RQ3, the variability of estimated coefficients across different months of the year highlights the need to rely on high frequency data, enabling to account for seasonality patterns to support policy makers taking informed decisions based on robust data driven evidence.

